Cristina Pereira Vieceli[2]
Rober Iturriet Avila[3]
Demographic, labor market and family structures changes tend to reinforce the role of women as responsible for supporting their families. Like this, in 1995, according to data from the National Household Sample Survey (PNAD-IBGE), only 22.9% of families were headed by women, while in 2018, the percentage increased to 44.3%[4]. That is, the participation almost doubled in the period, approaching the percentage of men, which correspond to 55.7%. Among the heads of household, 56% are black and brown women, and 43% are white (Graph 1).
Graph 1- Distribution of heads of household, by sex and color, 2018
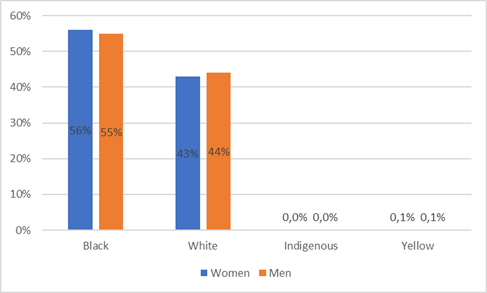
Source: Prepared by the author based on the microdata of Continuous PNAD
Despite the increase in households whose leadership is female, these are mainly allocated in the lowest pay ranges. In 2018, 56.8% of households headed by women had per capita income of up to 1 minimum wage, compared with 51.2% of those headed by men. The participation of households with female leadership in the lower income ranges – up to 1/4 MW was 11.1%, compared with 9.1% of men. In the range between 1/4 MW up to 1/2 MW per capita, the households headed by them correspond to 15.6%, in the case of their managers, the participation is 13.8% (Graph 2).
Graph 2- Distribution of households headed by women and men by per capita pay range, 2018
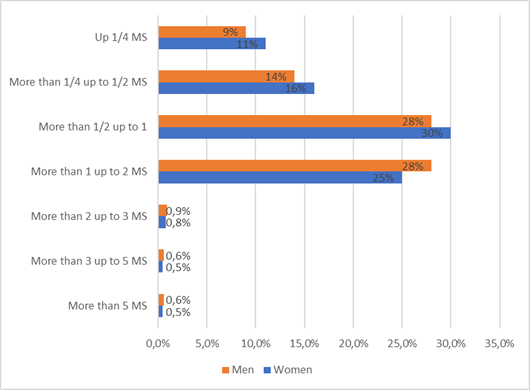
Source: Continuous PNAD Microdata, 2018 Microdados
Women are also the majority in the arrangements formed by guardians, without spouse and with children up to 14 years, corresponding to 90.3% of the total arrangements in this format. Among these, 68% were black, and 31% were white[5], and 20.6% of these women had per capita income of less than US$1.9 per day[6].
Women and men, when responsible for households, have different consumption profiles, resulting in both from the maintenance of wage inequalities, as well as related to gender constructions. This trend was observed in the feminist literature that deals with the subject, indicating that women, when they are responsible for maintaining their homes, spend a greater portion of their income on basic consumption items, such as food, clothing and housing. Men, on the other hand, comparatively spend a greater share of income on goods related to transportation, beverages, tobacco and to increase assets (ARAUCO, CASTRO, 2018; PINEDA, 2018; SÁNCHES, 2018; CASALE, 2012).
Concerning Brazil, data from the 2017-18 Family Budget Survey (POF) indicate that women, when they are references of families, spend a higher percentage of monthly income, compared with men, in expenses focused on food, housing, clothing, hygiene and personal care, health care – including medicines. Men, on the other hand, exceed in expenses related to transportation, taxes and increase of assets, with acquisition of real estate, and investments, according to Graph 3.
Graph 3 – Distribution of monthly expenses of reference persons by gender, according to the type of expenditure, Brazil (2017-2018) (%)
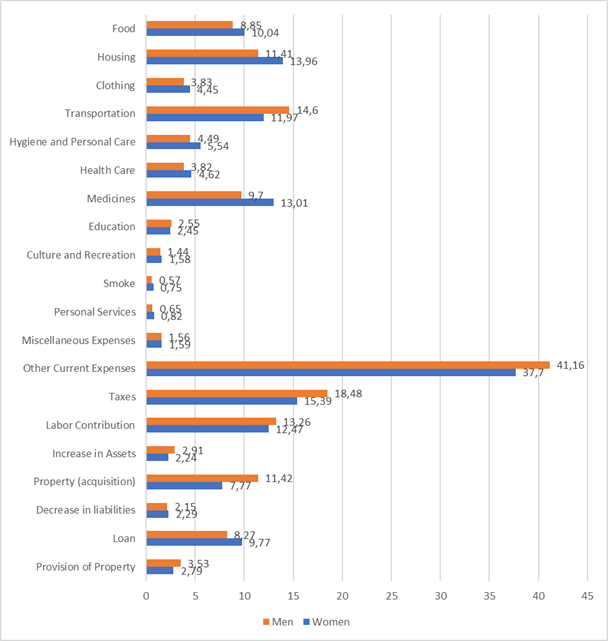
Raw data source: Household Budget Survey – POF (2017-2018)
Inequalities in the expenditure profile tend to reinforce the income gap between the sexes. This is because, compared to the chiefs, women spend a greater share of income on consumer goods, focused on family maintenance and a lower percentage in investments and increased assets, for example, in the acquisition of real estate. Even in expenses aimed at reducing liabilities, women spend most of their income on the payment of loans, and in which they exude more than they do in the provision of real estate.
One way to reduce social inequalities is through taxation. Although the incidence of indirect and regressive taxation is high in Brazil, the tax exemption on the basic basket tends to penalize less households whose leadership is female. On the other hand, men pay a higher total tax burden due mainly to expenses related to direct taxes, labor contributions and transportation. According to Table 1, the total tax burden of women representing households is 25.6%, compared to 27.6% of male women.
Table 1 – Tax burden by type of expenditure of household representatives, by gender, Brazil, 2017-2018 – (% of income)
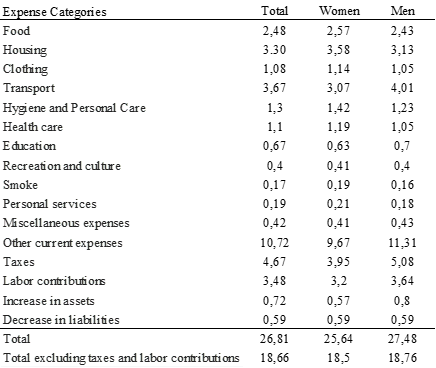
Source of raw data: Household Budget Survey – POF (2017-2018). Taxation data: Brazilian Institute of Planning and Taxation.
Without considering taxes and labor contributions – direct taxation, the
tax burden on heads of households, men and women is very similar –
approximately 18.5 %. In other words, indirect taxation in Brazil does not
reinforce or reduce gender inequalities by family leadership. It is important
to note, however, the importance of maintaining exemptions on basic basket
products, whose consumption expenditure falls mainly on women bosses.
REFERENCES:
ARAUSCO, V. CASTRO, C. Brechas de género y política tributária en Bolívia: apuntes para um debate. Friedrich Ebert Stifund – FES. Disponível em:
https://library.fes.de/pdf-files/bueros/kolumbien/14612.pdf
CASALE, D. Indirect taxation and Gender Equity: evidence from South Africa. Feminist Economics Review. Jul 2012. N. 18, vol 3. p. 25-54.
PINEDA, E. Perspectiva de género y justicia tributaria: una aproximación al caso venezolano. Friedrich Ebert Stiftung – FES. Disponível em:
http://library.fes.de/pdf-files/bueros/kolumbien/14360.pdf
SÁNCHES, M. A. Estado de
la tributación para la equidad de género en Ecuador. Friedrich Ebert Stiftung
– FES. Disponível em: https://library.fes.de/pdf-files/bueros/kolumbien/14359.pdf
[1]This article is a preview of a technical study on taxation and gender supported and coordinated by Instituto Justiça Fiscal (Tax Justice Institute) and prepared with the collaboration of DIEESE technician Edgard Rodrigues Fusaro, who surveyed the data of the Family Budget Survey – POF.
[2] PhD Candidate in Economics at Federal University of Rio Grande do Sul (UFRGS)
[3] PhD in Economics, professor and researcher at Federal University of Rio Grande do Sul (UFRGS)
[4] 2018 Continuous PNAD Microdata
[5] Synthesis of Social Indicators – IBGE
[6] Synthesis of Social Indicators (US$ per purchasing power parity -PPC (2011))